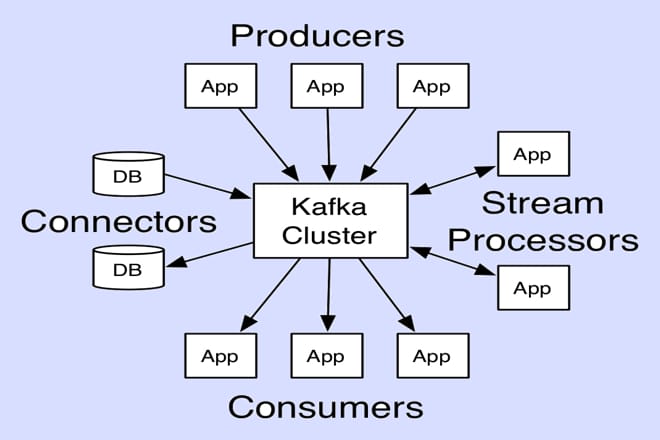
Apache Kafka stands as a powerhouse for handling large-scale, real-time data streams, enabling organizations to process and analyze vast amounts of information with remarkable efficiency. Managing Kafka clusters, however, can feel like navigating a complex labyrinth, especially as data volumes grow and systems scale. Kafdrop emerges as a vital tool, offering a user-friendly interface to simplify Kafka cluster management, providing visibility and control to administrators and developers alike. Its lightweight, web-based design makes it a go-to solution for monitoring and troubleshooting, ensuring smooth operations in dynamic environments.
This open-source platform integrates seamlessly with Kafka, delivering real-time insights into topics, partitions, consumers, and brokers without requiring extensive setup. By presenting a clear, intuitive dashboard, Kafdrop empowers teams to monitor message queues, inspect data, and diagnose issues swiftly. Whether you’re a seasoned Kafka administrator or a developer new to distributed systems, Kafdrop streamlines workflows, reduces complexity, and enhances productivity, making it an indispensable asset for modern data pipelines.
What Is Kafdrop and Why Use It?
Kafdrop’s Role in Kafka Ecosystems
Kafdrop serves as a web-based management tool specifically designed for Apache Kafka, providing a visual interface to interact with clusters. It simplifies the process of inspecting and managing topics, partitions, and consumer groups. By offering a browser-based dashboard, Kafdrop eliminates the need for command-line tools, making Kafka administration more accessible. Its lightweight nature ensures minimal resource usage, allowing seamless integration into existing Kafka environments. Teams rely on Kafdrop to gain quick insights into cluster health and performance.
Key Benefits of Using Kafdrop
Kafdrop delivers a range of advantages for Kafka users, particularly in large-scale deployments. Its real-time monitoring capabilities enable administrators to track message flows and system metrics instantly. The tool’s intuitive design reduces the learning curve for new users, while its compatibility with Kafka’s architecture ensures reliability. Kafdrop supports debugging and troubleshooting, helping teams resolve issues faster. Ultimately, it enhances operational efficiency by centralizing cluster management tasks in one platform.
How Kafdrop Differs from Other Kafka Tools
Unlike command-line utilities like Kafka’s built-in scripts or other GUI tools such as Confluent Control Center, Kafdrop strikes a balance between simplicity and functionality. It doesn’t require heavy infrastructure, making it ideal for teams seeking lightweight solutions. While some tools focus solely on monitoring, Kafdrop allows users to view message content and manage configurations. Its open-source nature ensures cost-effectiveness, and its active community drives continuous improvements, keeping it aligned with Kafka’s evolving ecosystem.
Core Features of Kafdrop for Kafka Management
Real-Time Cluster Monitoring
Kafdrop provides a comprehensive view of Kafka clusters, displaying real-time data on brokers, topics, and partitions. Users can monitor key metrics like message rates, partition sizes, and broker health at a glance. The dashboard updates dynamically, ensuring administrators stay informed about system performance. This feature helps identify bottlenecks or failures quickly, enabling proactive maintenance. Kafdrop’s monitoring capabilities make it easier to maintain high availability in data-intensive environments.
Topic and Partition Management
Kafdrop simplifies topic and partition oversight with an organized interface. Key functionalities include:
- Viewing topic details, such as partition count and replication factors.
- Inspecting message payloads to verify data integrity.
- Checking partition offsets to track message processing.
- Identifying under-replicated partitions for quick resolution.
- Monitoring topic configurations for consistency. These tools allow administrators to manage topics efficiently, ensuring smooth data flow and system reliability without diving into complex command-line operations.
Consumer Group Insights
Kafdrop excels at providing visibility into consumer groups, a critical aspect of Kafka management. Users can track consumer lag, monitor group membership, and assess consumption rates. This feature helps diagnose issues like lagging consumers or uneven partition assignments. By presenting consumer group data clearly, Kafdrop enables teams to optimize resource allocation and ensure timely message processing, reducing the risk of delays in data pipelines.
Setting Up Kafdrop for Kafka Clusters
Installation and Deployment Options
Kafdrop’s installation process is straightforward, supporting deployment via Docker, JAR files, or direct source builds. Docker offers the quickest setup, pulling the latest Kafdrop image and connecting it to a Kafka cluster with minimal configuration. For custom environments, users can download the JAR file and run it with Java. Kafdrop’s lightweight footprint ensures compatibility with various infrastructures, from local setups to cloud-based clusters, making deployment flexible and efficient.
Configuring Kafdrop with Kafka
To integrate Kafdrop with Kafka, users must specify connection details, such as bootstrap server addresses, in the configuration file or environment variables. Kafdrop supports secure connections via SSL/TLS and integrates with authentication mechanisms like SASL. Properly configuring ZooKeeper or Kafka’s bootstrap servers ensures seamless communication. Testing connectivity post-setup verifies that Kafdrop can access cluster metadata, enabling full functionality across the dashboard for monitoring and management.
Best Practices for Initial Setup
Successful Kafdrop deployment requires careful planning to optimize performance. Ensure Kafka brokers are accessible and properly configured before launching Kafdrop. Use environment variables to manage sensitive data like credentials securely. Set appropriate JVM options for memory allocation to handle large clusters. Regularly update Kafdrop to leverage the latest features and security patches. Finally, test the dashboard thoroughly to confirm accurate data display, ensuring reliable cluster oversight from the start.
Monitoring Kafka Clusters with Kafdrop
Tracking Broker Health and Performance
Kafdrop’s dashboard provides a detailed overview of broker status, including uptime, message throughput, and resource usage. Administrators can identify overloaded brokers or connectivity issues instantly. Key metrics to monitor include:
- Broker availability and response times.
- Disk and CPU usage per broker.
- Network throughput for data transfer.
- Active controller status for cluster leadership.
- Error rates for potential issues. These insights help maintain cluster stability and prevent downtime in critical systems.
Analyzing Topic and Partition Metrics
Kafdrop offers granular visibility into topic and partition performance, displaying metrics like message counts, offset ranges, and replication status. Users can drill down into specific partitions to check for imbalances or under-replicated data. This feature aids in optimizing partition assignments and detecting anomalies early. By tracking these metrics, teams can ensure efficient data distribution and avoid bottlenecks, keeping Kafka clusters running smoothly.
Identifying and Resolving Bottlenecks
Kafdrop’s real-time data helps pinpoint performance bottlenecks, such as slow consumers or overloaded partitions. By analyzing lag metrics and partition sizes, administrators can rebalance workloads or scale resources. The tool highlights issues like message backlog or uneven broker utilization, enabling quick interventions. Kafdrop’s clear visualizations make it easier to diagnose and resolve problems, ensuring consistent performance across the Kafka ecosystem.
Debugging and Troubleshooting with Kafdrop
Diagnosing Consumer Lag Issues
Consumer lag, where consumers fall behind in processing messages, can disrupt data pipelines. Kafdrop’s consumer group view displays lag metrics, showing the gap between produced and consumed messages. Key steps for resolution include:
- Checking consumer group membership for inactive consumers.
- Reviewing lag trends to identify persistent delays.
- Inspecting partition assignments for imbalances.
- Verifying consumer configurations for errors.
- Scaling consumer instances to handle load. These insights help restore timely message processing and prevent pipeline stalls.
Inspecting Message Content
Kafdrop allows users to view message payloads directly, aiding in debugging data issues. By inspecting message content, developers can verify serialization formats, check for corrupt data, or validate message schemas. This feature is particularly useful for identifying application-level errors or mismatches in data processing. Kafdrop’s intuitive interface simplifies message inspection, reducing the time spent troubleshooting and ensuring data integrity across the cluster.
Resolving Configuration Errors
Misconfigured topics or brokers can cause significant issues in Kafka clusters. Kafdrop highlights configuration details, such as replication factors or retention policies, for easy review. Users can identify inconsistencies, like mismatched partition settings or incorrect broker configurations, and address them promptly. By providing a centralized view of configurations, Kafdrop streamlines error resolution, helping teams maintain a stable and optimized Kafka environment.
Real-World Use Cases for Kafdrop
Streamlining Data Pipeline Operations
Kafdrop plays a crucial role in managing real-time data pipelines, ensuring smooth data flow from producers to consumers. Teams use it to monitor message throughput, detect delays, and optimize resource allocation. For example, e-commerce platforms rely on Kafdrop to track order events, ensuring timely processing. Its real-time insights help maintain pipeline efficiency, reducing latency and improving the reliability of data-driven applications across industries.
Supporting Development and Testing
Developers leverage Kafdrop during application development to inspect topics and validate message formats. By viewing message payloads and offsets, they can debug code and ensure correct data handling. Kafdrop’s lightweight setup makes it ideal for test environments, allowing teams to simulate production scenarios. This capability accelerates development cycles, enabling faster iteration and deployment of Kafka-based applications with confidence in their performance.
Enhancing Incident Response
When issues arise, such as consumer failures or partition imbalances, Kafdrop enables rapid incident response. Administrators can quickly identify the root cause using real-time metrics and visualizations. For instance, a financial services company might use Kafdrop to resolve transaction processing delays by analyzing consumer lag and rebalancing partitions. Its clear interface and detailed data empower teams to address incidents efficiently, minimizing downtime and maintaining system reliability.
Conclusion
Kafdrop transforms Kafka cluster management by offering a user-friendly, real-time interface that simplifies monitoring, debugging, and optimization. Its robust features, from topic inspection to consumer lag analysis, empower teams to maintain high-performing data pipelines. By streamlining setup and providing actionable insights, Kafdrop enhances efficiency and reduces complexity. For organizations leveraging Kafka’s power, Kafdrop stands as a critical tool, ensuring seamless operations and enabling teams to focus on delivering value through their data-driven applications.