Kafdrop serves as a powerful, open-source web-based UI for monitoring and managing Apache Kafka clusters, offering a user-friendly interface to visualize topics, partitions, and other critical Kafka components. Designed to simplify interaction with Kafka’s distributed messaging system, Kafdrop allows developers, data engineers, and system administrators to inspect cluster metadata, monitor message flow, and troubleshoot issues efficiently. Its intuitive design makes it an essential tool for anyone working with Kafka’s complex ecosystem, providing real-time insights into topic and partition details.
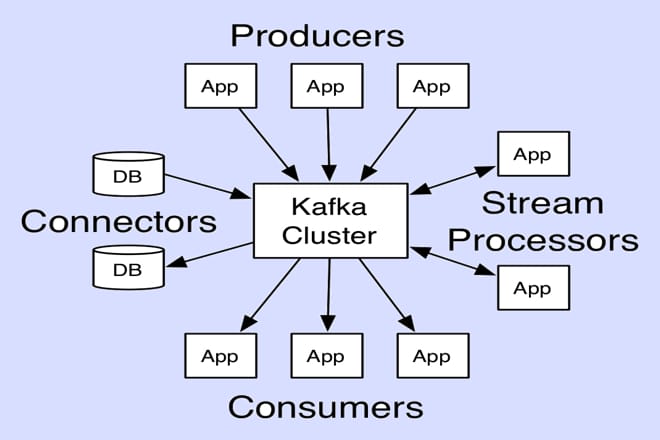
Understanding how Kafdrop displays Kafka topics and partitions is key to leveraging its full potential for cluster management. Topics in Kafka act as categories or feeds where messages are published, while partitions enable scalability by distributing topic data across multiple brokers. Kafdrop presents this information in a structured, accessible format, helping users track message offsets, partition assignments, and consumer group activity. This article explores Kafdrop’s mechanisms for displaying these elements, offering clarity on its features and practical applications.
By diving into Kafdrop’s interface, users can uncover actionable insights about their Kafka environment, from topic configurations to partition health. Whether managing a small development cluster or a large-scale production system, Kafdrop’s visualization capabilities streamline the process of monitoring and debugging. This guide breaks down how Kafdrop organizes and presents Kafka topics and partitions, providing a detailed look at its features to help users optimize their Kafka workflows effectively.
Overview of Kafdrop’s Interface for Kafka Management
Dashboard Layout and Navigation
Kafdrop’s dashboard provides a clean, intuitive layout that simplifies Kafka cluster exploration. Upon logging in, users see a high-level overview of the cluster, including active brokers, topic lists, and consumer groups. Navigation menus allow quick access to topic details, partition information, and message previews. The interface uses responsive design, ensuring accessibility across devices. This structure enables users to monitor Kafka components efficiently without overwhelming technical complexity.
Real-Time Data Updates
Kafdrop dynamically updates cluster information, reflecting changes in topics and partitions in near real-time. It fetches metadata from Kafka brokers to display current states, such as partition offsets and leader assignments. Users can observe message flow and lag without manual refreshes. This live monitoring capability ensures timely detection of issues like lagging consumers or uneven partition distribution. Kafdrop’s real-time updates make it a reliable tool for proactive cluster management.
Customization Options for Display
Kafdrop allows users to tailor the interface to their needs, adjusting how topic and partition data are presented. Options include sorting topics by name, size, or message count, and filtering partitions by status. Users can configure refresh intervals to balance real-time updates with performance. These customization features enhance usability, enabling teams to focus on critical metrics. Kafdrop’s flexibility supports diverse workflows, from debugging to long-term monitoring.
How Kafdrop Displays Kafka Topics
Topic List and Summary
Kafdrop presents a comprehensive list of all topics within a Kafka cluster on its main dashboard. Each topic entry includes key details like the number of partitions, replication factor, and total message count. Users can click on a topic to dive into its specifics, such as configuration settings and partition assignments. This summary view helps users quickly assess topic health and activity. The interface prioritizes clarity, making topic exploration straightforward.
Key Topic Metrics and Insights
Kafdrop highlights essential metrics for each topic, providing insights into its performance and usage. These metrics include:
- Message Throughput: Displays the rate of incoming messages per topic.
- Partition Distribution: Shows how messages are spread across partitions.
- Consumer Lag: Indicates delays in message consumption by consumer groups.
- Retention Period: Details the configured data retention time. These metrics enable users to identify bottlenecks or misconfigurations, ensuring optimal topic performance and resource allocation.
Filtering and Searching Topics
Kafdrop offers robust filtering and search functionality to locate specific topics in large clusters. Users can search by topic name or filter based on criteria like partition count or message volume. This feature is particularly useful in production environments with hundreds of topics. The search interface is responsive, delivering instant results as users type. Kafdrop’s filtering tools streamline topic management, saving time during monitoring and troubleshooting tasks.
Exploring Partition Details in Kafdrop
Partition Overview and Structure
Kafdrop provides a detailed view of partitions for each topic, showing how data is distributed across the cluster. Each partition entry lists its ID, leader broker, replicas, and in-sync replica (ISR) status. Users can see the offset range, indicating the earliest and latest messages stored. This granular view helps identify partition-specific issues like replication lag. Kafdrop’s clear presentation simplifies understanding of complex partition configurations.
Offset and Message Tracking
Partitions in Kafka store messages sequentially, and Kafdrop displays offset details to track message positions. Users can view the first, last, and current offsets for each partition, alongside the total message count. This information is critical for monitoring consumer progress and detecting stuck offsets. Kafdrop also allows message inspection, showing content previews for debugging. These features make partition-level analysis both accessible and actionable.
Leader and Replica Information
Kafdrop shows which broker acts as the leader for each partition and lists its replicas. This helps users understand data distribution and fault tolerance. If a leader is offline or replicas are out of sync, Kafdrop highlights these issues visually. Monitoring leader and replica status ensures cluster reliability, especially in high-availability setups. Kafdrop’s clear visualization aids in quick diagnosis of partition-related problems.
Monitoring Consumer Groups and Partition Assignments
Consumer Group Overview
Kafdrop displays consumer groups and their associated topics, showing how partitions are assigned to consumers. The interface lists active consumers, their offsets, and lag metrics. Key details include:
- Group Status: Indicates whether the group is active or idle.
- Partition Assignments: Shows which partitions each consumer handles.
- Lag Trends: Tracks delays in message processing over time. This overview helps users ensure balanced workloads and healthy consumption patterns.
Partition Reassignment Tracking
Kafdrop tracks partition reassignments, which occur during cluster scaling or broker failures. It shows pending reassignments and their progress, helping users monitor cluster stability. Visual indicators highlight partitions undergoing reassignment, ensuring transparency. This feature is vital for maintaining performance during cluster maintenance. Kafdrop’s reassignment tracking minimizes downtime risks and supports smooth operations.
Troubleshooting Consumer Lag
Consumer lag, where consumers fall behind in processing messages, is a common Kafka issue. Kafdrop identifies lag per partition and consumer group, offering insights into delays. Users can:
- Analyze Lag Causes: Pinpoint slow consumers or high message volumes.
- Adjust Consumer Settings: Use Kafdrop’s data to optimize configurations.
- Monitor Recovery: Track lag reduction after interventions. These tools help resolve lag issues quickly, ensuring efficient message processing.
Visualizing Message Flow and Partition Health
Message Flow Visualization
Kafdrop visualizes message flow within topics and partitions, showing real-time production and consumption rates. Users can see how messages move through partitions, identifying bottlenecks or uneven workloads. The interface uses graphical elements like charts to represent throughput trends. Key features include:
- Throughput Graphs: Display message rates over time.
- Partition Load: Highlights heavily used partitions.
- Consumer Activity: Tracks consumption patterns. This visualization aids in optimizing cluster performance and resource allocation.
Partition Health Indicators
Kafdrop monitors partition health, flagging issues like under-replicated partitions or offline leaders. Visual cues, such as color-coded status icons, make problems easy to spot. Users can drill into affected partitions to investigate causes, such as network issues or broker failures. This proactive monitoring prevents data loss and ensures high availability. Kafdrop’s health indicators streamline cluster maintenance and troubleshooting.
Real-Time Alerts and Notifications
Kafdrop supports real-time alerts for partition-related issues, such as high lag or replication failures. Users can configure notifications to receive updates via email or integrated platforms. These alerts help teams respond promptly to potential problems, minimizing downtime. The system prioritizes critical issues, ensuring focus on high-impact events. Kafdrop’s alert system enhances cluster reliability and operational efficiency.
Advanced Features for Topic and Partition Management
Topic Configuration Management
Kafdrop allows users to view and edit topic configurations, such as retention policies and partition counts. The interface displays current settings and provides options to adjust them directly. This feature simplifies administrative tasks like increasing partitions for scalability. Changes are logged for transparency, ensuring traceability. Kafdrop’s configuration tools empower users to fine-tune topics for optimal performance.
Partition Rebalancing Support
Partition rebalancing ensures even data distribution across brokers, and Kafdrop facilitates this process. Users can initiate rebalancing and monitor its progress through the UI. The system highlights affected partitions and brokers, providing real-time updates. This feature is crucial for maintaining cluster efficiency during scaling or recovery. Kafdrop’s rebalancing support minimizes manual effort and enhances cluster stability.
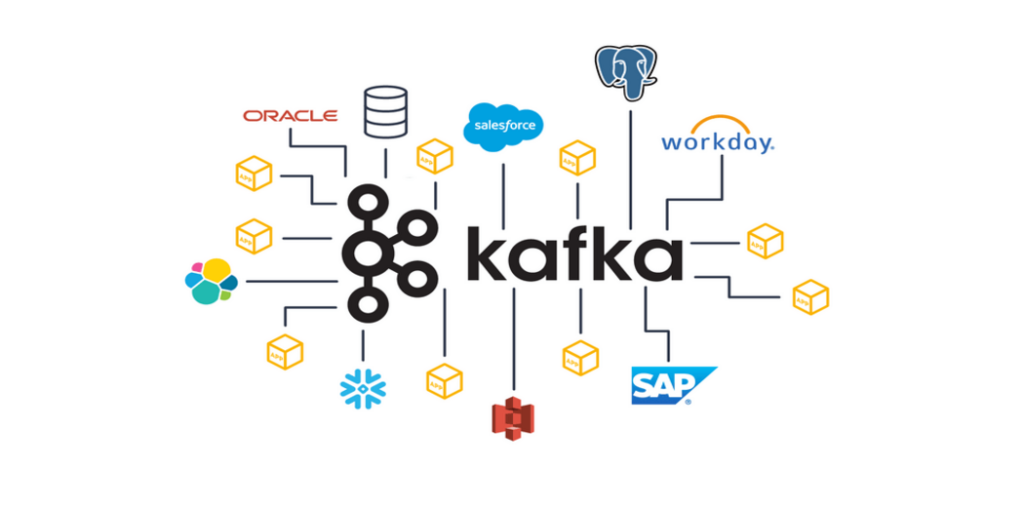
Integration with External Tools
Kafdrop integrates with external monitoring and alerting tools, such as Prometheus and Grafana, for enhanced visibility. Users can export topic and partition metrics to these platforms for advanced analytics. The interface supports API access for programmatic data retrieval. This integration enables comprehensive monitoring within existing workflows. Kafdrop’s compatibility with external tools makes it a versatile addition to Kafka ecosystems.
Conclusion
Kafdrop simplifies Kafka cluster management by offering an intuitive interface to display topics, partitions, and consumer group activity. Its real-time updates, customizable views, and detailed metrics empower users to monitor and troubleshoot effectively. From visualizing message flow to managing partition health, Kafdrop provides actionable insights for optimizing Kafka performance. By leveraging its features, teams can ensure reliable, scalable messaging systems, making Kafdrop an indispensable tool for Kafka administrators and developers.